Most traders do not lose money because they lack information. They lose because they see too much of it. Charts fill up with moving averages, oscillators and drawings, yet the entry still feels like a coin flip.
I have watched this pattern repeat for two decades, across equities, forex and crypto desks. The traders who improve are rarely the ones with more indicators. They are the ones with fewer, clearer rules.
That is exactly the gap GainzAlgo V2 Alpha aims to close. Instead of adding another oscillator to your screen, it delivers one decision at a time: buy, sell, target, stop. Below, we break down what the tool actually is, how the logic works and where it fits inside a sensible trading routine.
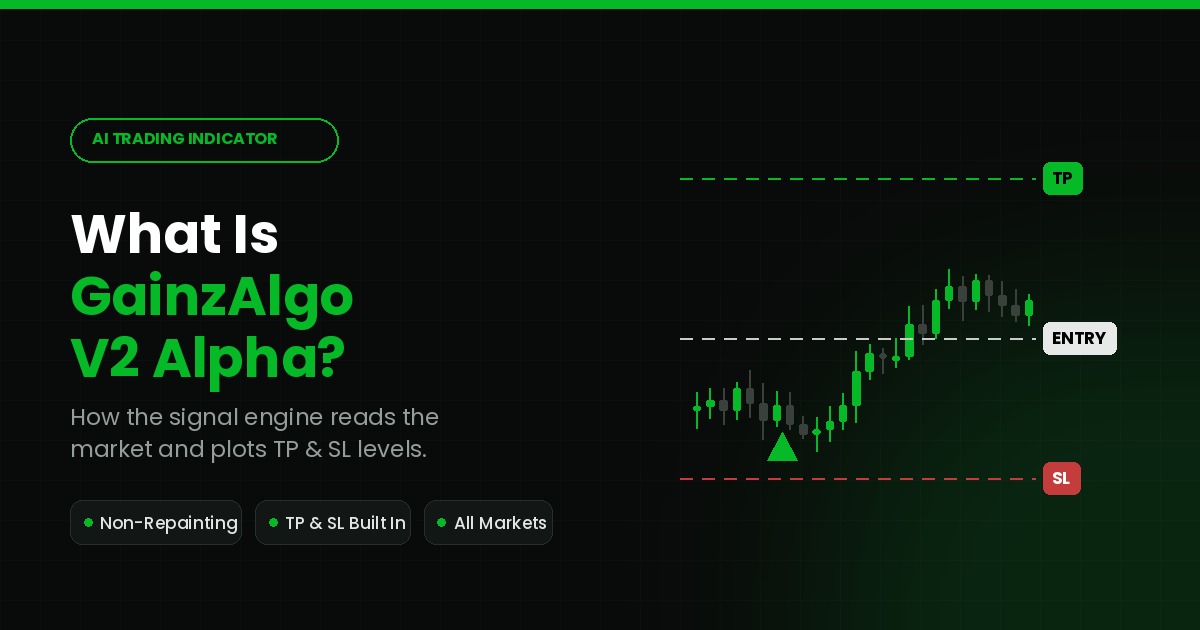
GainzAlgo V2 Alpha is an AI trading indicator built for the TradingView platform. It plots buy and sell signals directly on your chart, along with take profit and stop loss levels for every signal.
In plain terms, it behaves like an automated technical analyst. It watches price behaviour candle by candle, then prints a signal when its internal conditions line up.
Importantly, it is not a robot that places orders for you. You stay in control of execution, position size and risk. The indicator simply handles the analysis and hands you a structured trade idea.
The wider GainzAlgo V2 suite includes several configurations. V2 Alpha represents the most detailed rule set of the group, designed for traders who prefer fast-reacting, high-resolution logic.
Classic tools such as RSI, MACD and stochastics remain useful. However, they were designed for a slower market era.
Back then, humans placed most orders by phone or terminal. Today, algorithmic systems drive a large share of volume in major equity and derivatives markets. As a result, price reacts faster, and fixed formulas often arrive late.
There is a second problem too. Legacy indicators measure one thing each. RSI measures momentum. Moving averages measure trend. Neither one asks whether the current setup is actually worth trading.
Consequently, traders stack five or six tools together and hope the combination works. Analysis paralysis follows soon after. A modern signal engine solves this differently, by combining those checks inside one calculation and showing only the outcome.
The process runs in four clear stages. Each stage narrows the field, so weak setups never reach your screen.
First, the algorithm samples current price action. It examines structure, momentum shifts, volatility and short-term cycle behaviour on the timeframe you have open.
Rather than applying one fixed formula, it recalculates as new data arrives. Therefore, a quiet range and a volatile news spike are treated as two different environments.
Next, several internal filters run in sequence. These checks look for agreement between trend direction, momentum strength and transition behaviour.
If the conditions disagree, no signal appears. This multi-filter approach is the reason your chart stays clean during choppy sessions.
Then comes the most underrated part of the design. The indicator confirms signals on bar close and keeps them fixed.
In other words, it does not repaint. What you saw last Tuesday is still exactly what appears in your history today. That consistency matters enormously for review and backtesting, and we will return to it shortly.
Finally, the tool marks the trade plan on your chart. Each signal arrives with an entry, a take profit level and a stop loss level.
Because those levels appear immediately, you can size the position before emotion enters the picture. This is where a take profit and stop loss indicator earns its keep. It converts a vague idea into a measurable trade with a defined risk-to-reward profile.
The phrase "AI" gets used loosely in trading, so let us be precise about what adaptive logic means here.
Traditional scripts apply the same maths regardless of conditions. An adaptive engine adjusts instead. When volatility expands, filters tighten to reduce false positives. When liquidity thins, sensitivity shifts toward confirmed movement only.
Think of it as reading the road ahead rather than the rear-view mirror. The calculation responds to what the market is doing now, not to what a formula assumed decades ago.
Additionally, the engine evaluates multiple conditions at once. Structure, momentum and volatility all feed the same decision. That layered approach explains why signals appear less often, yet feel more deliberate when they do.
Every indicator vendor advertises accuracy. Few discuss repainting, although it quietly ruins far more accounts.
A repainting indicator changes its past signals after the fact. Historical charts then look flawless, while live trading tells a very different story. Traders blame themselves, when the tool was really rewriting history.
The GainzAlgo V2 Alpha indicator avoids that trap by locking signals once a candle closes. Consequently, three practical benefits follow.
Frankly, I would choose a transparent, non-repainting tool over a flashy one every single time. Reliability compounds. Illusions do not.
Ask any experienced trader where accounts really break. The answer is rarely entries. It is exits.
Traders hold losers too long and cut winners too early. Both habits come from making decisions after the trade is already open, under pressure.
Pre-plotted levels remove that pressure. Since the target and stop appear with the signal, three questions get answered before you click buy:
If the answer to the third question is no, you skip the trade. That single filter improves results for many traders more than any entry tweak ever will.
The tool runs on TradingView, which offers a free plan. After purchase, access is granted to the TradingView username you provide, and the script then appears in your indicator list.
Regarding coverage, the V2 Alpha configuration works across markets and timeframes. Traders apply it to forex pairs, indices such as NAS100 and SPY, crypto, commodities and equities.
That said, behaviour differs by asset and speed. Lower timeframes produce more signals and more noise. Higher timeframes produce fewer signals with more context.
My advice, therefore, is simple. Pick two instruments and one timeframe. Watch how signals behave for a couple of weeks before expanding. Familiarity beats variety early on.
A signal tool only performs as well as the process around it. These five habits separate consistent users from frustrated ones.
1. Trade with structure, not against it. Check the higher timeframe trend first. Signals aligned with the dominant direction usually behave better.
2. Respect the plotted stop. Moving a stop mid-trade turns a defined risk into an open-ended one.
3. Fix your position size. Risk a consistent, small percentage of capital per trade. Consistency, rather than conviction, keeps drawdowns survivable.
4. Set alerts instead of staring. Alerts let the tool watch the chart while you get on with your day.
5. Journal every signal. Record the ones you took and the ones you skipped. Patterns in your own behaviour will emerge within a month.
Theory helps, but routine matters more. Here is how a typical session tends to look in practice.
Before the session opens, you check the higher timeframe direction on your chosen pair. Next, you note the key levels you already care about, such as prior highs, session opens or obvious ranges.
Then you wait. Signals from GainzAlgo V2 Alpha appear only when conditions align, so patience becomes part of the method rather than a punishment.
When an alert fires, you check three things quickly: the direction, the plotted stop distance and the resulting reward ratio. Afterwards, you either take the trade at your fixed risk or pass on it.
Finally, you close the platform. No refreshing, no adjusting, no rescuing. That boring rhythm is precisely what long-term consistency looks like.
Some traders gain immediately. Others should build basics first.
The tool suits busy people who cannot monitor charts all day. It also suits newer traders who need structure, and experienced traders who want a faster second opinion on their bias.
However, it will not rescue an undisciplined account. If risk management feels optional, no signal engine can compensate for that. Learn position sizing first, then add tooling.
Trustworthy tools deserve honest framing, so let me be direct.
No indicator predicts the future. Markets contain genuine randomness, plus events no chart can anticipate. Losing trades will occur, sometimes several in a row.
What a well-built system does provide is consistency. It applies the same rules on every candle, without fear, boredom, or revenge. Over a large sample, that discipline is the real edge in the trading business.
Results also vary between users, because execution varies between users. Two traders can receive identical signals and end the month very differently.
Does it work on the free TradingView plan? Yes. The platform itself is free to use, and the indicator loads onto your chart once access is granted.
Is it fully automated? No. It analyses and signals. You place the trades, which keeps final judgement in your hands.
Which timeframe performs best? There is no universal answer. Many traders prefer 15-minute to 4-hour charts, since that range balances signal frequency with reliability.
Trading rewards clarity far more than complexity. A clean chart, a repeatable rule set and defined risk will usually outperform a screen full of conflicting tools.
That philosophy sits at the heart of GainzAlgo. The team built the V2 Alpha configuration around transparency, non-repainting signals and pre-plotted risk levels, so traders can focus on execution rather than interpretation.

This post has been authored and published by one of our premium contributors, who are experts in their fields. They bring high-quality, well-researched content that adds significant value to our platform.